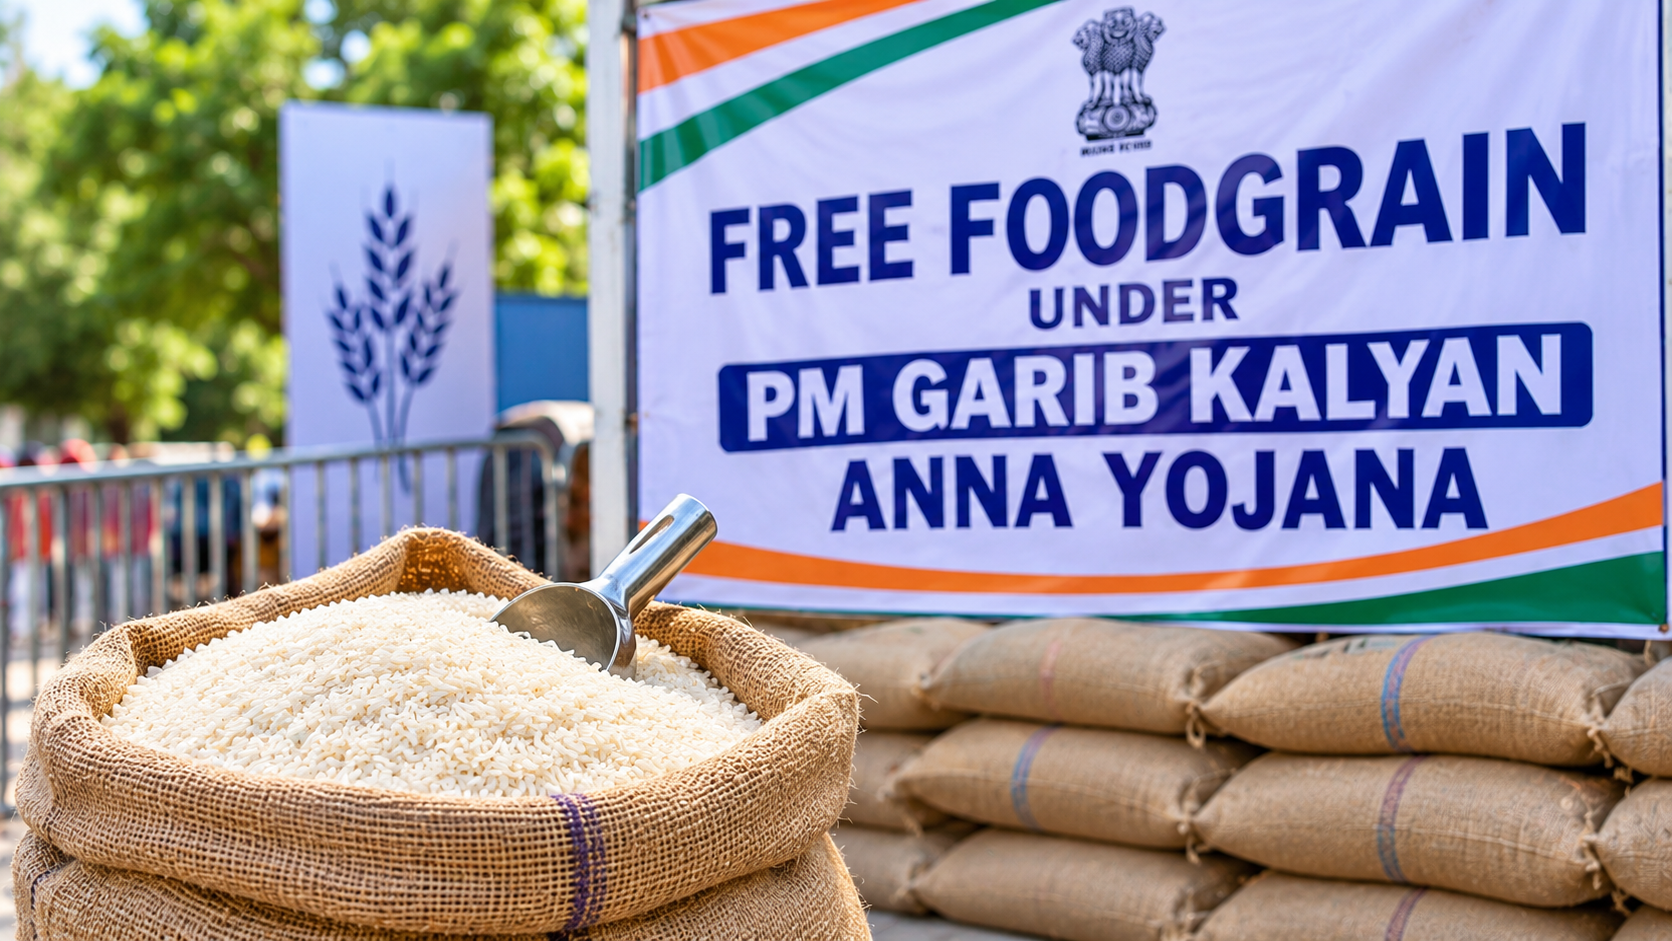
India has reported a dramatic decline in poverty as the World Bank estimates that only 2.6% of the population live below the $3-a-day threshold in 2023-24. However, the 800 million people who are given free food exceed the $4.2 poverty headcount in 2011-12. Poverty reduction is coming from welfare support, including free foodgrain from the government, and not real income growth. This carries a risk of the government curtailing the giveaways during scenarios of high inflation and fiscal deficit, finds Dhananjay Sinha, CEO and Co-Head, Systematix Group.
Dhananjay Sinha
India has reported a dramatic decline in poverty, with only 2.6% of the population estimated to be below the $3-a-day threshold in 2023-24. Are we witnessing a genuine transformation in living standards, or are the numbers overstating the improvement because of methodological limitations?
The numbers are quite puzzling. The poverty headcount ratio at the $3 purchasing power parity (PPP) threshold has declined to 2.6% from 27% in 2011-12. Similarly, at the $4.2-a-day threshold, the ratio has fallen from nearly 60% to 16.1%.
Historically, this is a dramatic decline. Data dating back to 1977 shows that this is a momentous fall. At face value, it appears that India has achieved the socio-economic objectives it has pursued for decades. However, the numbers do not seem to reflect the actual household situation.
There is a significant contrast between these estimates and GDP numbers and household condition indicators. The latest estimates are based on the Household Consumption Expenditure Survey conducted in 2022-23 and 2023-24, after a gap of 11 years. Consequently, there is no clear comparison with 2011-12. The earlier Consumption Expenditure Survey followed a very different framework and is not directly comparable with the new survey. These changes in survey methodology have introduced significant statistical biases.
What criteria does the World Bank use when estimating poverty across countries?
The World Bank has three poverty thresholds: $3, $4.2 and above $8 a day. These are derived through global comparisons. The methodology involves converting a common basket of goods across countries and determining the prices people would pay for it.
However, this common basket does not necessarily capture all the goods included in India’s consumption basket. This creates limitations when using purchasing power parity to assess India’s poverty situation.
There is also a lack of comparability between the 2011-12 Consumption Expenditure Survey and the new Household Consumption Expenditure Survey. The number of goods included and the way surveys are conducted have changed. These differences affect both global comparisons and comparisons with India’s own historical data.
More than 800 million Indians continue to receive free foodgrain. Does this point to a fundamental disconnect between poverty estimates and the actual economic condition of households?
This is a very important point. More than 800 million people have been receiving free foodgrain under the Pradhan Mantri Garib Kalyan Anna Yojana since the Covid pandemic. This support has continued for nearly six years.
In 2011-12, around 732 million people were below the World Bank’s $4.2 poverty line. Today, despite the dramatic decline in the poverty headcount ratio, more than 800 million people are receiving free foodgrain. This suggests that household conditions may have weakened. Another comparison is with the beneficiaries of the Below Poverty Line (BPL) and Antyodaya Anna Yojana schemes in 2011-12. These schemes together had approximately 326 million beneficiaries. The current number of free foodgrain beneficiaries is about 2.5 times higher.
A significant part of the poverty reduction we are witnessing could therefore be attributable to foodgrain support and other income-support schemes provided by the Centre and state governments. The decline in poverty is not entirely organic; it is substantially supported by government welfare transfers.
Are we actually reducing poverty or merely managing it through welfare support? How does the present situation differ from the poverty reduction witnessed between 2004 and 2012?
Between 2004 and 2011, poverty also declined. However, that period was characterised by fairly strong economic growth and a significant improvement in average wages and household incomes.
Our calculations, based on gross value added from national accounts data and employment data from the Periodic Labour Force Survey, show a significant rise in real income per worker during that period. Poverty reduction was therefore accompanied by an improvement in household wage incomes. It was a more organic process driven by economic growth.
After 2012, however, we have witnessed a significant deceleration in real household incomes. Between 2011-12 and 2024, real income per worker grew by roughly 2% annually, while estimated real consumption expenditure grew by around 3.2%.
This creates a paradox: worker income growth has slowed considerably even as poverty rates have declined sharply. Historically, higher real worker incomes have translated into lower poverty. The current trend is inconsistent with that relationship and with economic logic.
India has added 168 million jobs between FY18 and FY24. But much of this increase appears to come from self-employment, unpaid family work and low-productivity agriculture. Are these jobs generating adequate incomes?The Periodic Labour Force
Survey introduced in 2018 showed a substantial increase in employment. In 2018, unemployment was reported at 6.1%, almost a four-decade high. Subsequently, labour force participation and employment numbers increased significantly.
By 2023-24, around 643 million people were reported as employed, an addition of approximately 168 million over six years. This is an unusually large increase compared with historical trends.
However, much of this addition has come from self-employment and agriculture. There has also been an increase in low-productivity activities in services. Barring construction, several sectors have witnessed a rise in disguised or underemployment.
More importantly, this increase in employment has not translated into higher incomes. Income growth per worker has decelerated from around 5.5% to approximately 2% on a compounded basis. This is among the lowest rates witnessed in the last 30-35 years.
India has strong GDP growth, but worker incomes and productivity appear to be stagnating while wealth remains concentrated in certain pockets. How disturbing is this income disparity?
Poverty, growth and inequality are the three pillars of development. While GDP growth appears robust, the new national accounts base has scaled down nominal GDP by approximately ₹10 lakh crore annually and consumption expenditure by around ₹20 lakh crore annually compared with the earlier 2011-12 base.
The earlier approach involved extrapolating formal-sector data to estimate informal-sector activity. As more data became available, some of the earlier overstatement has been corrected.
The formal sector continues to grow strongly, but this growth is not translating into higher labour incomes. It suggests that growth is increasingly concentrated in capital-intensive sectors, with larger players and conglomerates gaining dominance across industries. This has resulted in low employment elasticity.
More people are being absorbed into informal activities and agriculture, where productivity is lower. The nominal value addition of unincorporated enterprises has grown by only around 3% on a compounded basis over five years, below inflation.
Rural wages have also grown modestly. With inflation at around 5-5.5%, real wages have remained flat or negative. The World Bank report itself highlights that the income of the top 10% is 13 times that of the bottom 10%. Moreover, survey data does not include the top 5%, which could make the disparity even greater.
If poverty reduction has to be durable, what needs to change in India’s growth model? Can welfare transfers alone sustain the gains?
The poverty reduction success story needs to be viewed with considerable caution because much of the decline in the poverty ratio derives from government support through free food and other income transfers.
These programmes may be necessary, but they also indicate that underlying household conditions could be much weaker than the headline numbers suggest.
There is a risk that if inflation remains high or fiscal constraints emerge because tax revenues are inadequate, the government may have to curtail spending on poverty alleviation programmes. We have already seen changes in the employment guarantee programme, with allocations and utilisation falling by nearly 50%.
If such support weakens, people who are currently being measured as having moved out of poverty could slip back into deprivation. India needs a more sustainable improvement in livelihoods, similar to what happened between the 1970s and 2012, particularly between 2004 and 2012. Poverty reduction during that period was accompanied by rising real incomes and productive employment.
The present drift towards unproductive activities, particularly in agriculture, needs to be reversed. More people must move into manufacturing and productive services, creating better-quality employment and sustainable incomes.
Welfare schemes remain necessary because a large section of India’s population is economically vulnerable. But the decisive focus must be on productive job creation and income generation so that households and the economy can sustain themselves.
The decline in poverty is real. The danger is that the apparent success could create policy complacency, which may eventually reverse the gains.
Disclaimer : This story is auto aggregated by a computer programme and has not been created or edited by DOWNTHENEWS. Publisher: deccanchronicle.com