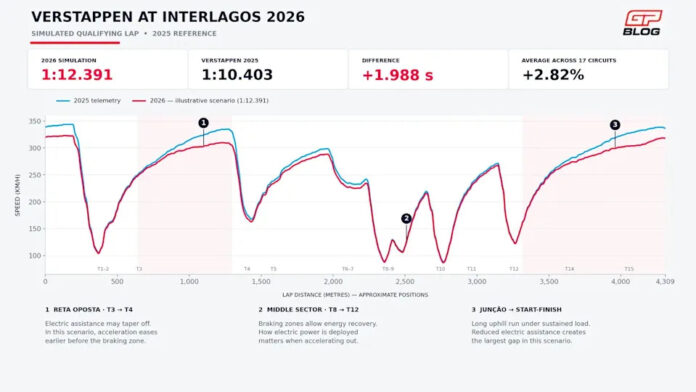
Based on this season’s qualifying times, Max Verstappen would be on course for a lap of around 1:12.391 in Brazil. That is almost two seconds slower than his fastest qualifying lap at Interlagos in 2025. A GPblog simulation shows where the differences could emerge, with the long climb towards the start-finish line a key area of focus for Red Bull Racing.
Interlagos puts the new Formula 1 cars to the test in several ways. Drivers face heavy braking zones, a technical middle sector and two long sections where the power unit has to do a lot of work. The throttle stays pressed for a long time, particularly from Junção, Turn 12. The track climbs there and sweeps through the final corners towards the finish line.
Advertisement
That makes the distribution of electrical energy important for the 2026 power units. Strong acceleration on corner exit provides an immediate burst of speed, but assistance also needs to remain available further along the straight. As usual ahead of the weekend, GPblog has calculated an indicative lap time and simulated what the speed profile at Interlagos could look like.
How fast could Verstappen be in Brazil?
For the calculation, the fastest qualifying laps of 2026 up to and including the Mexico Grand Prix were compared with those from 2025. At each circuit, the absolute fastest time from Q1, Q2 or Q3 is used, regardless of which driver set it. Sprint qualifying sessions were excluded, leaving 17 comparable circuits. Madrid and Sepang have no corresponding qualifying session from 2025, so they are not included in the average. Barcelona is included, matched with the Spanish Grand Prix held there last year.
Across those 17 circuits, the fastest qualifying laps this season are an average of 2.82 per cent slower. The differences vary considerably. In Mexico, the deficit was limited to around 1.23 per cent, while in Austin it was 1.65 per cent. At Silverstone, Spa and Monza, the difference was around 3.8 per cent. Verstappen’s fastest qualifying lap in Brazil last year was a 1:10.403. Applying the average difference of 2.82 per cent gives a lap time of 1:12.391, a loss of approximately 1.988 seconds.
Max Verstappen’s simulated potential fastest lap during qualifying in Brazil – Source: GPblog
Max Verstappen’s simulated potential fastest lap during qualifying in Brazil – Source: GPblog
Advertisement
That result does need some context. Verstappen was knocked out in Q1 in 2025 and qualified P16. His lap is used here as the reference, but it does not represent a pole position or a flawless qualifying weekend. The calculation applies the average speed difference in 2026 to that specific performance. It remains to be seen how much Verstappen can actually get out of the current Red Bull at Interlagos.
Long climb makes electrical assistance important
In the graph, the blue line shows the reconstructed speed profile from the 2025 telemetry. The red line shows a possible profile for 2026, adjusted to match the calculated lap time. The location and scale of the individual speed differences are assumptions made for this simulation. In this scenario, the biggest visible difference emerges on the climb from Junção. Verstappen needs to carry speed out of that corner into a long section where there is little opportunity to recover energy under braking.
When electrical assistance fades along the way, the car accelerates less strongly. Its speed does not necessarily drop straight away. The car can continue accelerating, while the speed curve starts to flatten earlier. In the simulation, the gap to 2025 therefore grows further towards the start-finish line. How pronounced that effect will actually be depends, among other things, on the chosen energy deployment and the car’s drag – its aerodynamic resistance.
Advertisement
The Reta Oposta, between Turns 3 and 4, also deserves attention. A good exit from the Senna S helps with acceleration, after which electrical assistance has to be distributed along the straight. The red line (in the graph above) also shows how the speed gain could tail off later along the straight.
Alongside the challenges of the 2026 regulations, rain could also be on the cards in Brazil – Photo: Red Bull Content Pool
Alongside the challenges of the 2026 regulations, rain could also be on the cards in Brazil – Photo: Red Bull Content Pool
Middle sector offers different opportunities
Several braking zones lie between the long acceleration phases. They offer opportunities to recover energy, which can then be deployed again on corner exit. In the middle sector in particular, braking, turning in and accelerating follow one another in quick succession. Grip, balance and traction also determine how much speed Verstappen can carry through there. After all, the difference between 2025 and 2026 is not down to the engines alone: aerodynamics, tyres and car dimensions have changed as well.
Advertisement
Above all, the simulation highlights why the long sections at Interlagos deserve attention. The calculated 1:12.391 is a mathematical baseline, not a precise prediction to the nearest thousandth of a second. As mentioned, track conditions and tyres have not been filtered out of the season average. For Red Bull in Brazil, the question is how much speed Verstappen can build on corner exit – and how much assistance will then remain available until the next braking zone.
Disclaimer : This story is auto aggregated by a computer programme and has not been created or edited by DOWNTHENEWS. Publisher: Sports.yahoo.com