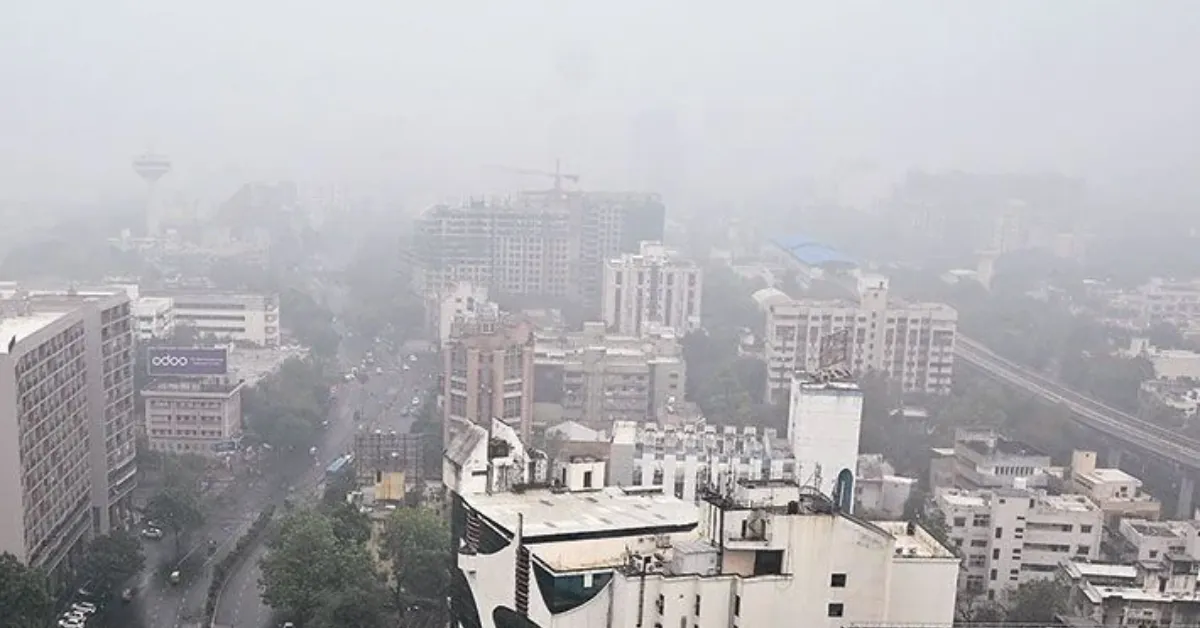
A patch of dust near a busy road, smoke rising from an industrial chimney, and waste burning in an open space may all contribute to a city’s air pollution. But the sources responsible for poor air quality are not necessarily the same across neighbourhoods.
This means that a measure addressing pollution in one part of a city may not be equally effective elsewhere. Understanding what contributes to poor air quality at specific locations is therefore an important part of planning cleaner cities.
Ahmedabad is attempting to address this challenge by looking beyond citywide air-quality readings and examining pollution at specific locations.
The Ahmedabad Municipal Corporation (AMC), in collaboration with IIT Kanpur, has identified 10 locations across the city for a real-time air-quality monitoring initiative called SMART-VAYU. Reported by The Times of India (TOI) on September 30, 2026, the project aims to identify local pollution hotspots, trace the sources of emissions and generate data that can help civic authorities plan targeted interventions.
Initial monitoring exercises at two locations — Sabarmati Riverfront Sports Complex and Narendra Modi Stadium — have already revealed how pollution sources can differ within the same city.
One city, two different pollution profiles
The initial findings from Ahmedabad offer an interesting look at how the sources contributing to air pollution can vary from one location to another.
In its October 17, 2026 report, TOI detailed the findings from air-quality sampling at the Sabarmati Riverfront Sports Complex and Narendra Modi Stadium.
Sampling at the riverfront was conducted between May 4 and May 24, while monitoring at Narendra Modi Stadium took place between June 25 and August 8.
At the Sabarmati Riverfront, dust accounted for 36% of the estimated source contribution, compared with 23% at Narendra Modi Stadium.
Coal combustion contributed 24% at the riverfront, while its estimated contribution at the stadium was just 1%.
The pattern was different at Motera.
The combined category of marine emissions and refuse burning accounted for 38% of the estimated pollution sources at Narendra Modi Stadium, compared with 16% at the riverfront. Power plant-related sources contributed another 20% at the stadium.
The analysis also examined different types of organic aerosols. Traffic-related organic aerosols contributed 18% at Narendra Modi Stadium and 13% at the riverfront. Solid-fuel combustion-related organic aerosols accounted for 16% at the stadium and 5% at the riverfront.
These findings highlight an important aspect of urban air pollution: even within one city, different locations can have different pollution profiles.
Understanding these differences can help authorities identify which sources need attention in specific areas, rather than approaching air pollution as a uniform problem across the city.
Why Ahmedabad is looking beyond citywide AQI readings
Identifying the sources behind air pollution is not always straightforward.
Citywide air-quality readings provide information about pollution levels, but understanding what is contributing to poor air quality in a particular neighbourhood requires more detailed monitoring.
This is the gap that SMART-VAYU aims to address.
The initiative stands for Sensing and Monitoring for Air Quality using Real-time Technology – Vision-based Ahmedabad air analysis for Urban Management.
The project involves three broad components: mapping existing pollution sources, establishing a hyperlocal monitoring network and developing a decision-support system for urban air-quality management.
For this, AMC and IIT Kanpur finalised 10 monitoring locations across Ahmedabad.
These include Sabarmati Riverfront Sports Complex, Narendra Modi Stadium, Gujarat Police Academy at Karai, Sanskardham, Veer Savarkar Sports Complex, Pirana AMC community service centre, Rakhial AMC health office, Vatva GIDC’s Chandrakala complex, Bopal urban health centre and Thaltej AMC ward office.
The selection considered meteorological conditions, particulate matter readings, annual wind patterns, satellite-based aerosol optical depth and estimated PM2.5 concentrations. Practical requirements such as electricity, security, accessibility and airflow were also taken into account.
The plan is to deploy five locations with mobile laboratory sampling alongside sensors, while the remaining five will have fixed sensors. The wider project envisages eventually expanding the network to around 400 sensors across Ahmedabad.
How the monitoring network will identify pollution sources
Unlike conventional monitoring systems that primarily provide broader air-quality readings, these sensors will continuously measure pollutants such as PM2.5, PM10, nitrogen oxides, carbon monoxide, ozone and sulphur dioxide.
They will also record meteorological parameters, including temperature and humidity.

An important component is the mobile Real-Time Source Apportionment Laboratory (RTSA), which will help examine the contribution of different pollution sources.
Source apportionment is the process of estimating how much different sources contribute to the pollutants present in the air.
These could include vehicular emissions, industrial activity, road dust, construction and waste burning.
By examining these contributions, the initiative aims to generate pollution hotspot maps, forecasts and alerts that can help authorities identify locations requiring attention.
From identifying pollution to planning targeted action
Ahmedabad already has an air-quality monitoring network under the Centre’s System of Air Quality and Weather Forecasting and Research (SAFAR) programme. Its monitoring stations provide city-level air-quality information and forecasts.
SMART-VAYU seeks to add another layer of information by examining pollution sources at specific locations.
For civic authorities, this distinction could help connect monitoring with specific pollution-control measures.
For instance, identifying road dust as a major contributor could inform dust-control and road-cleaning measures. Similarly, evidence of industrial emissions or waste burning could help direct inspections and enforcement.
The effectiveness of the initiative will depend on how consistently the monitoring network operates, whether its findings translate into enforceable measures and how improvements in air quality are tracked over time.
Ultimately, Ahmedabad’s initiative highlights why tackling urban air pollution requires more than understanding how polluted a city is. It also requires knowing what is polluting different parts of it.
Because when pollution sources vary from one neighbourhood to another, the solutions must account for those differences too.
Sources:
‘Ahmedabad: SMART-VAYU to zoom in on air pollution hotspots’: By Kapil Dave, Published on 30 September 2026
‘Ahmedabad maps pollution hotspots ahead of 2030 Commonwealth Games’: By Meghdoot Sharon, Published on 17 October 2026
‘IIT-K Ahmedabad Gets Real-Time Pollution Tracking Activity’: By Kotak School of Sustainability – IIT Kanpur
Disclaimer : This story is auto aggregated by a computer programme and has not been created or edited by DOWNTHENEWS. Publisher: thebetterindia.com